A Year in My Life
2010-06-18
As most of you know, I keep a personal journal where I record my thoughts and significant daily happenings. Unlike most people who journal - but probably typical as a Linux guy - I keep my journal digitally as plain text. Because it's searchable, I often include references to previous events and people that I am reminded of. I almost depend on it now as an integral part of my memory, and will sometimes be surprised when some incident I remember wasn't recorded in it.
Anyway, recently I started playing with graph visualization. I discovered Graphviz, which automatically moves nodes arounds to make the graph understandable. Primarily I needed it to do some visualizations for my research, but I then realized that the back references between journal entries are perfect for visualization.
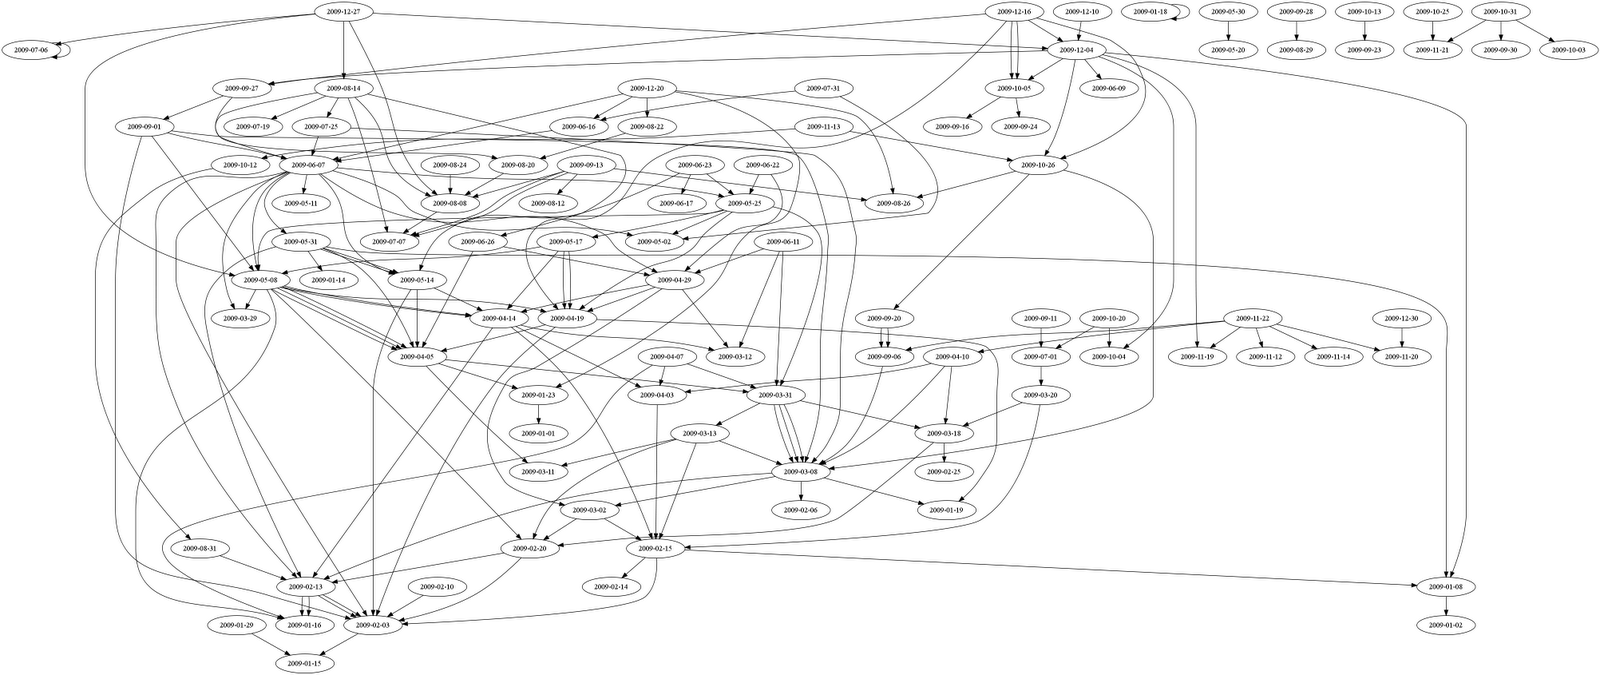
Here's the graph for 2009. There are some extra edges to entries from other years which are not drawn.
That's 99 vertices and 183 edges, out of 110 entries for the entire year. Because most entries only reference previous dates, the dates are earlier near the bottom of the graph. You can see some seemingly important dates in the year, ones which I reference often: 2009-03-08, for example, and 2009-04-05. They can be identified by the high in-degree.
Out of curiosity, I also made a graph for my entire journal, a small version of which is shown below. The full version is 27917x4667 pixels, and weighs in at 20 mb.
The horizontal lines are not indicative of anything - it's just an artifact from how Graphviz works. This much larger graph contains 940 vertices and 1821 edges, out of 1283 entries I've written in the last 8 years. I don't have anything to say about it though.

